Use Cases
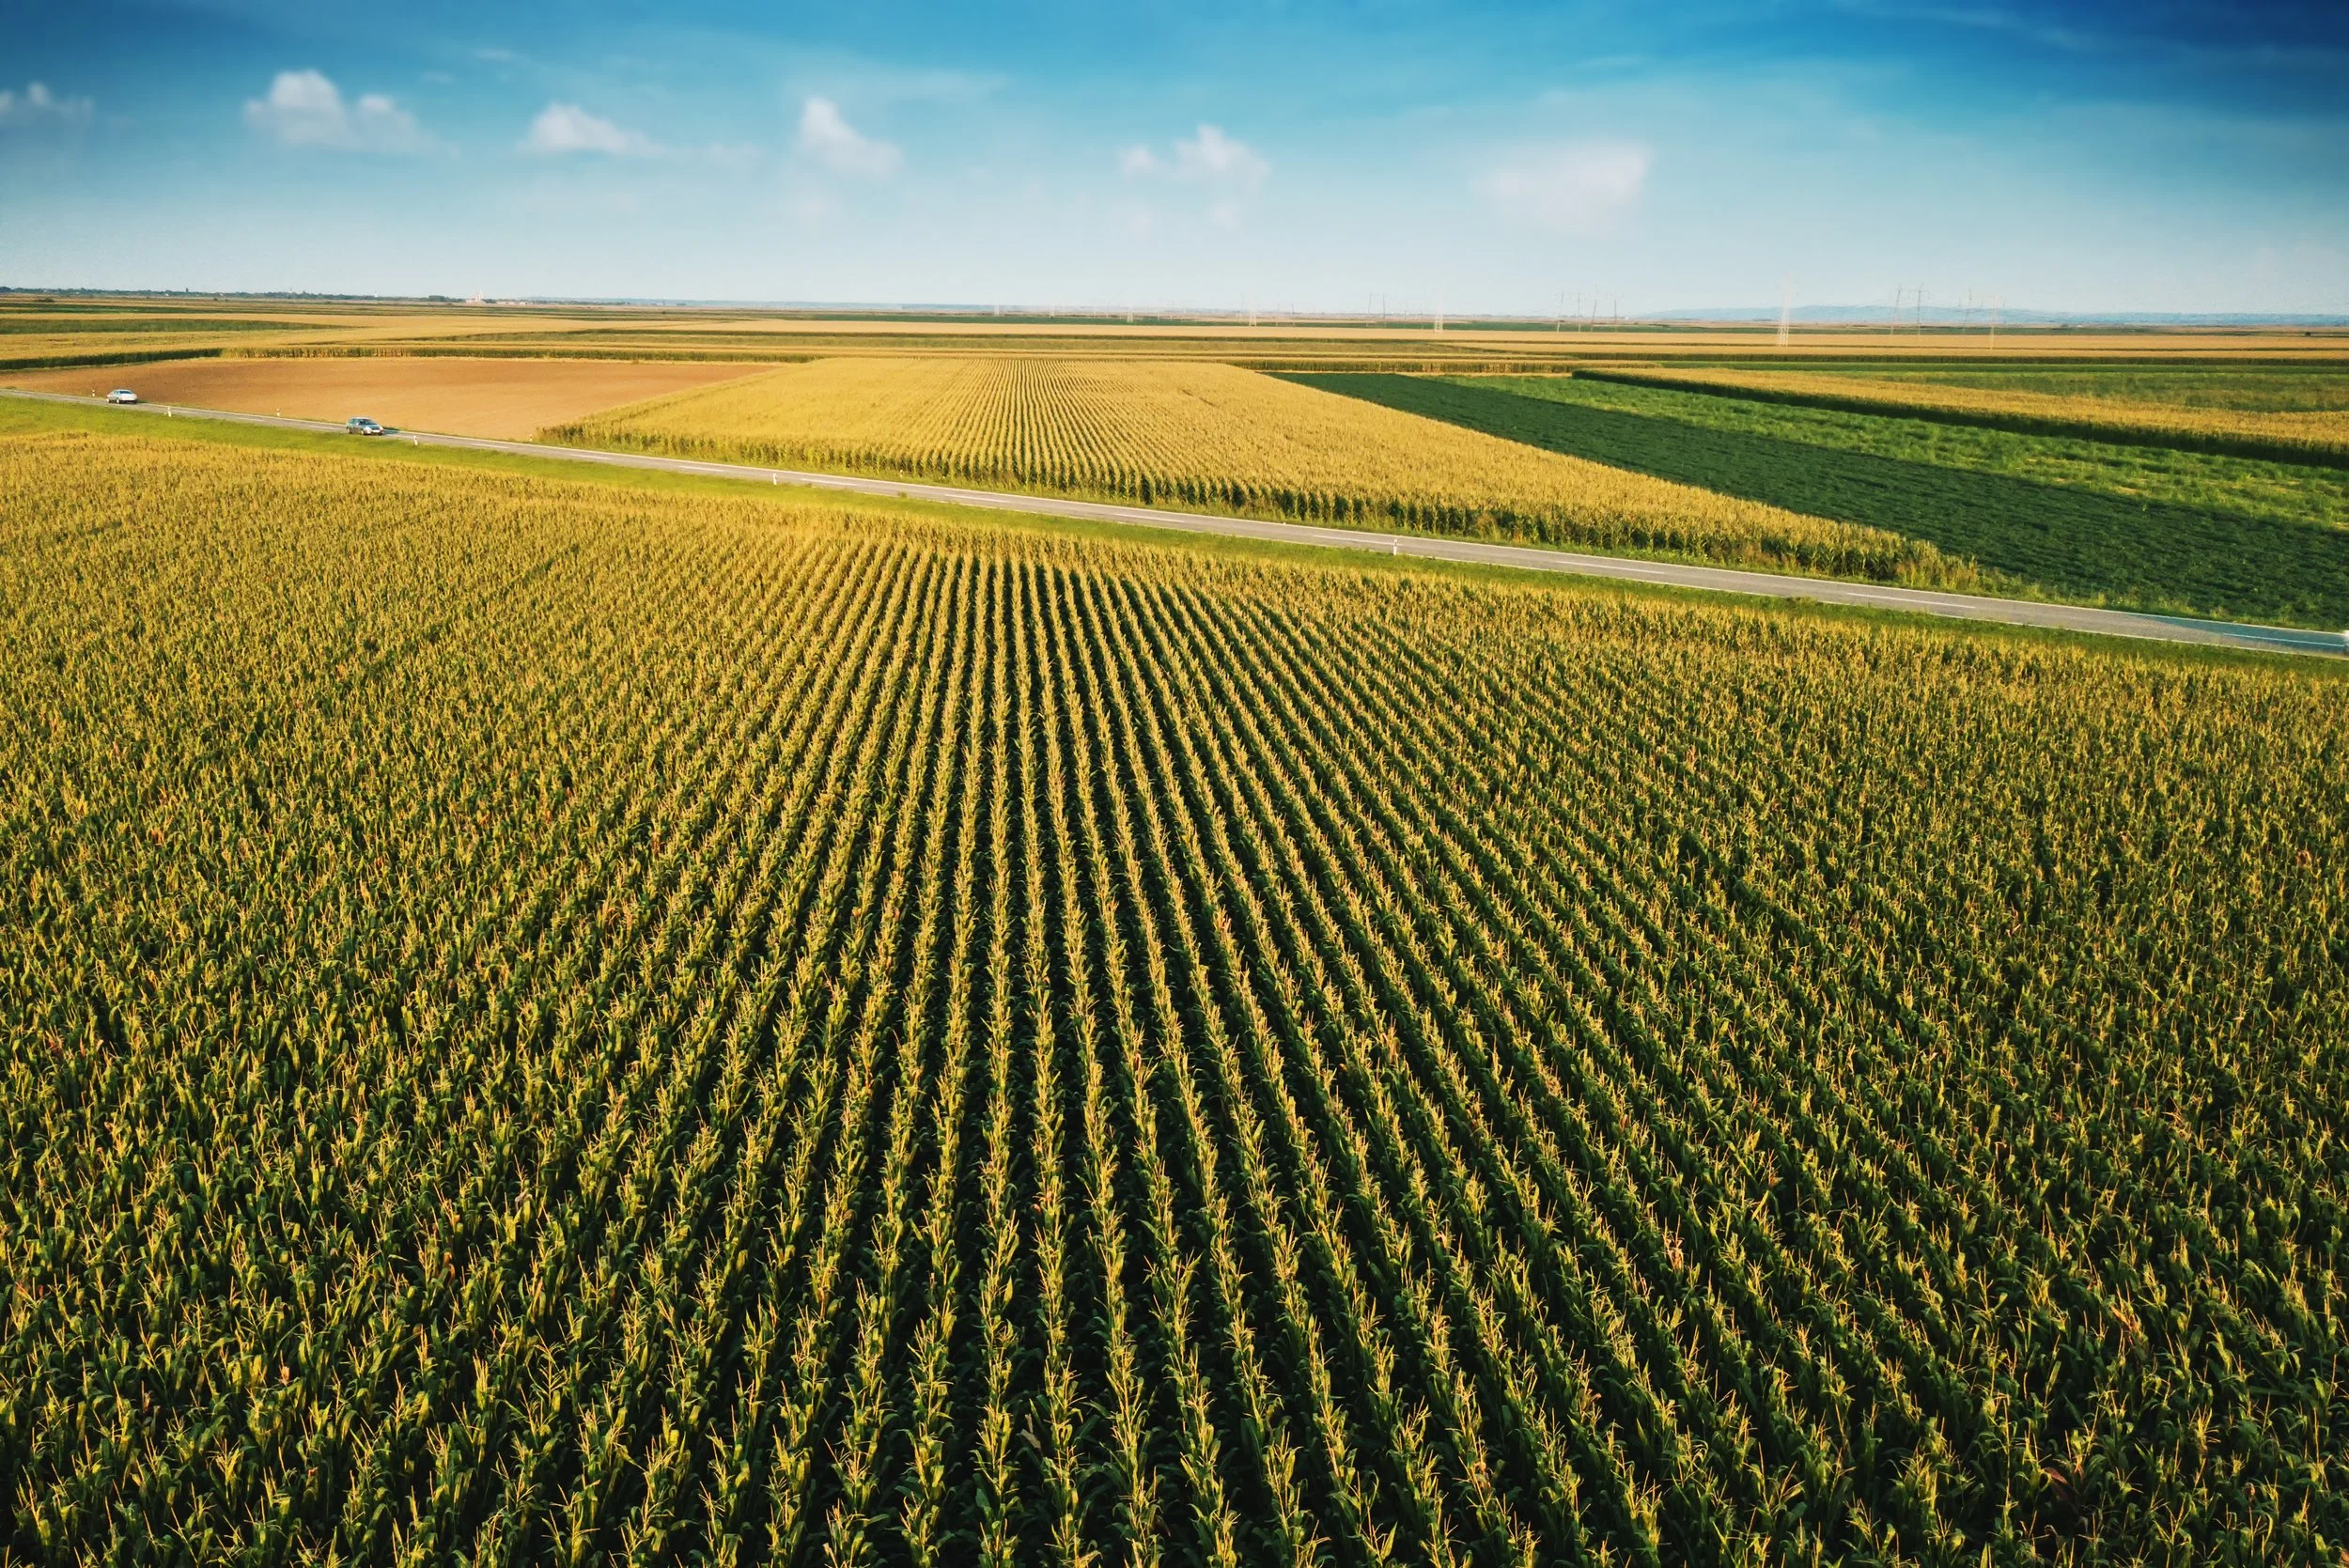
Variable Rate Replanting Using Vegetation Index Mapping
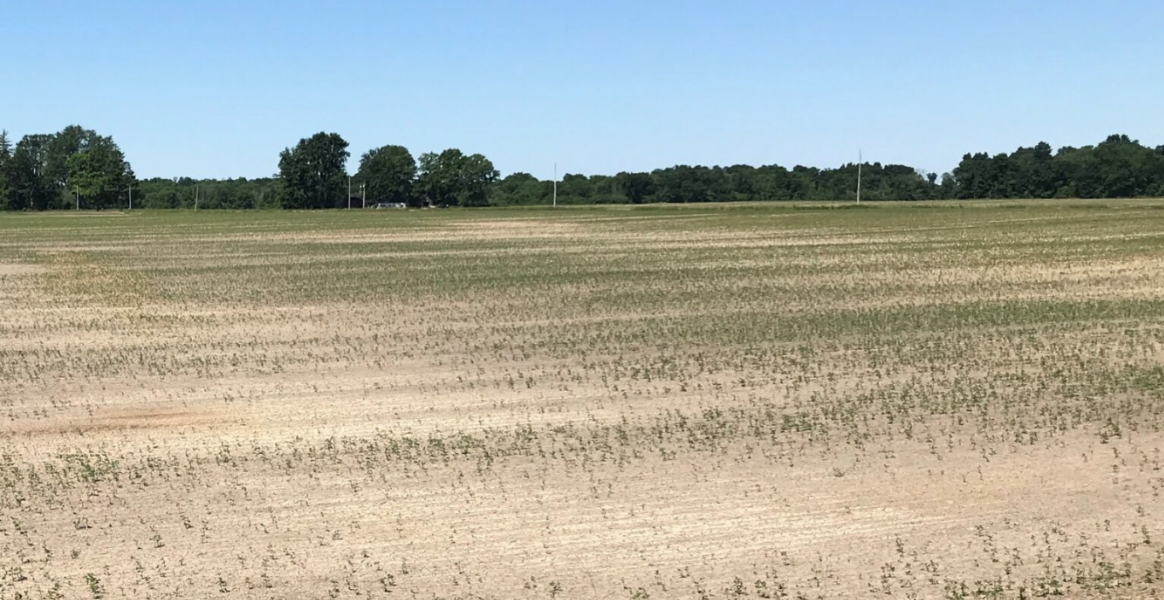
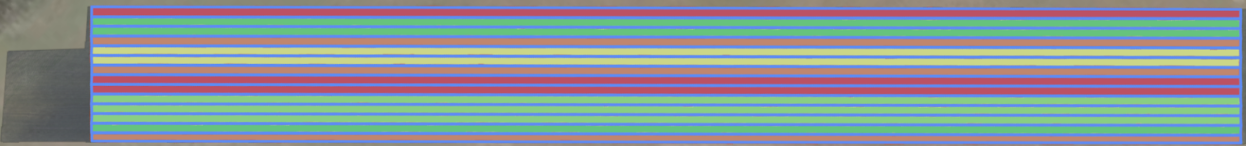
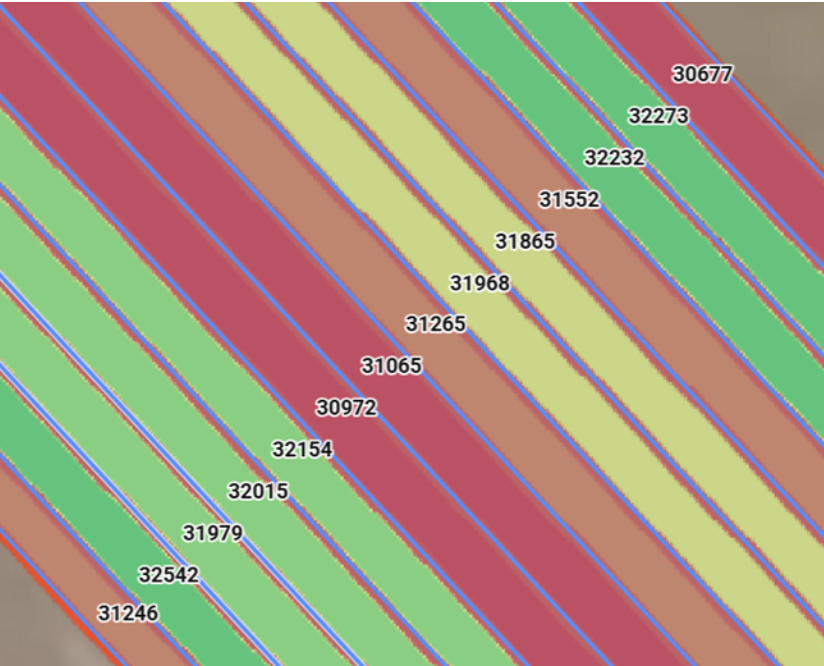
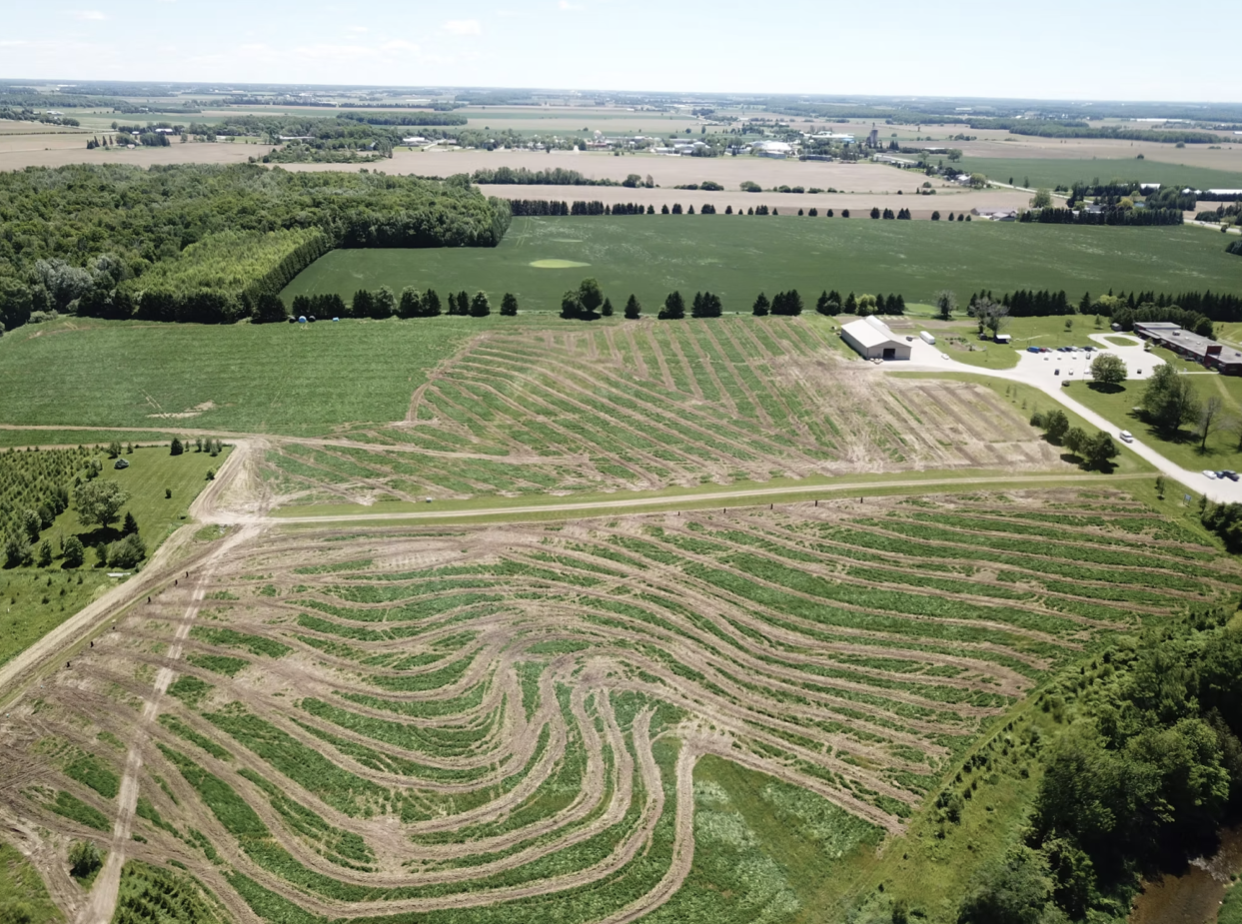
Sparse vegetation soybean field

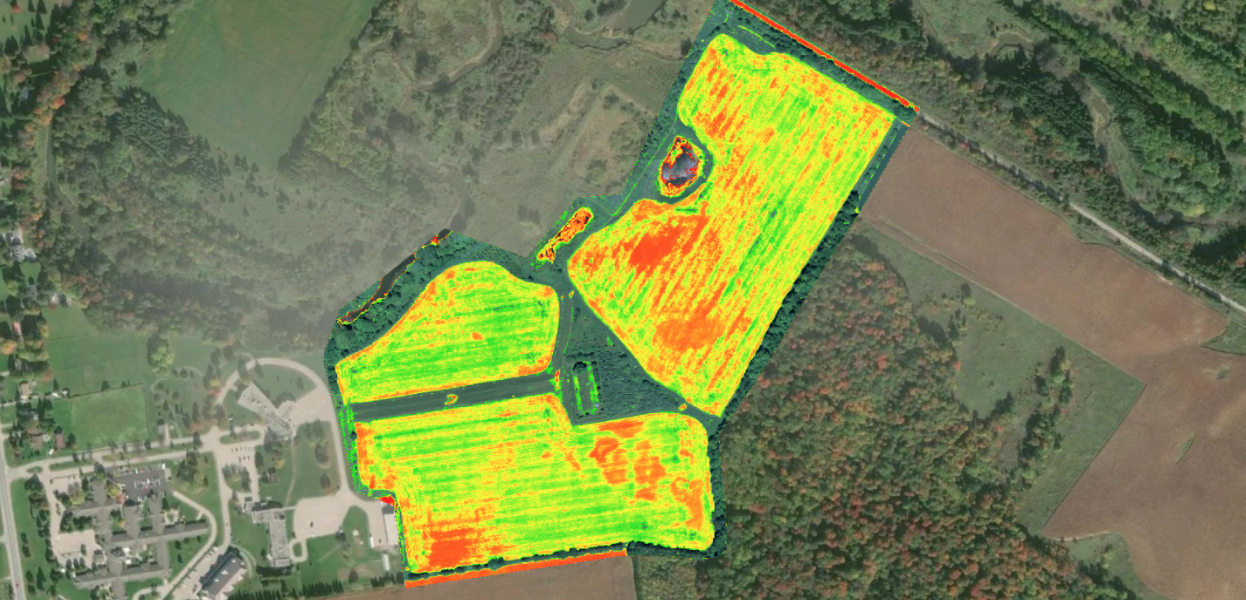
Visible spectrum map (left) and processed multispectral variable rate planting map (right)
Challenge
A soybean grower was dealing with highly uneven crop emergence after an early-season cold snap. Some areas had solid stands, while others were nearly bare. The grower wanted to replant, but not uniformly, so they could avoid overspending on seed in areas that didn’t need it.
Approach
We conducted a multispectral drone flight to scan the field during early emergence. Since the soybean plants were still too small for visible detection, we applied a series of vegetation indices to identify zones of relative biomass. After testing multiple index layers, we found one that reliably distinguished sparse from denser stands. Using this data, we classified the field into five unique vegetation zones. Each zone was assigned a replanting rate tailored to actual need. The resulting shapefile was exported as a variable-rate prescription map, ready for upload into the grower’s seeding equipment.
Result
The grower was able to replant only where necessary, reducing their seed input by an estimated 30%. More importantly, the final stand achieved a high level of uniformity, which improved yield consistency across the field. This entire process, from flight to prescription map, was completed within 24 hours, giving the grower the speed and confidence to replant during a tight weather window.
Silage Bunker Volume Estimation for Feed Planning

Corn Silage Bunker
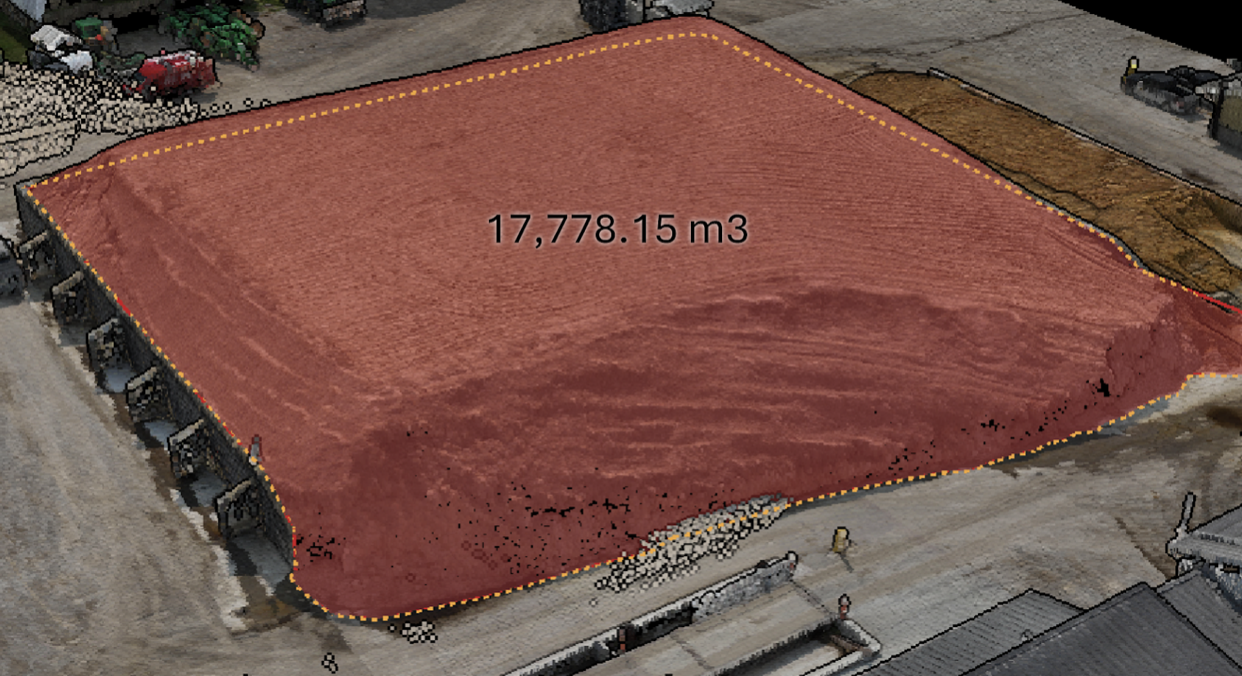
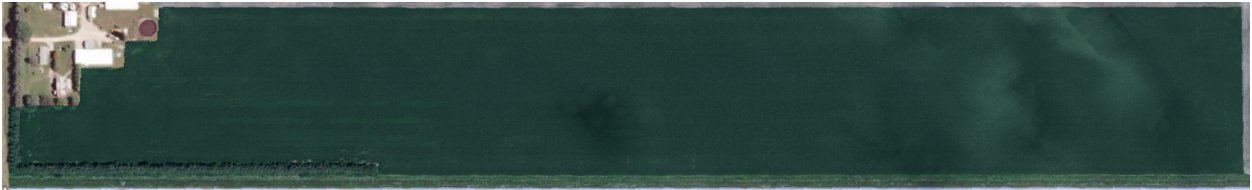
Precise Volume Measurement Spring
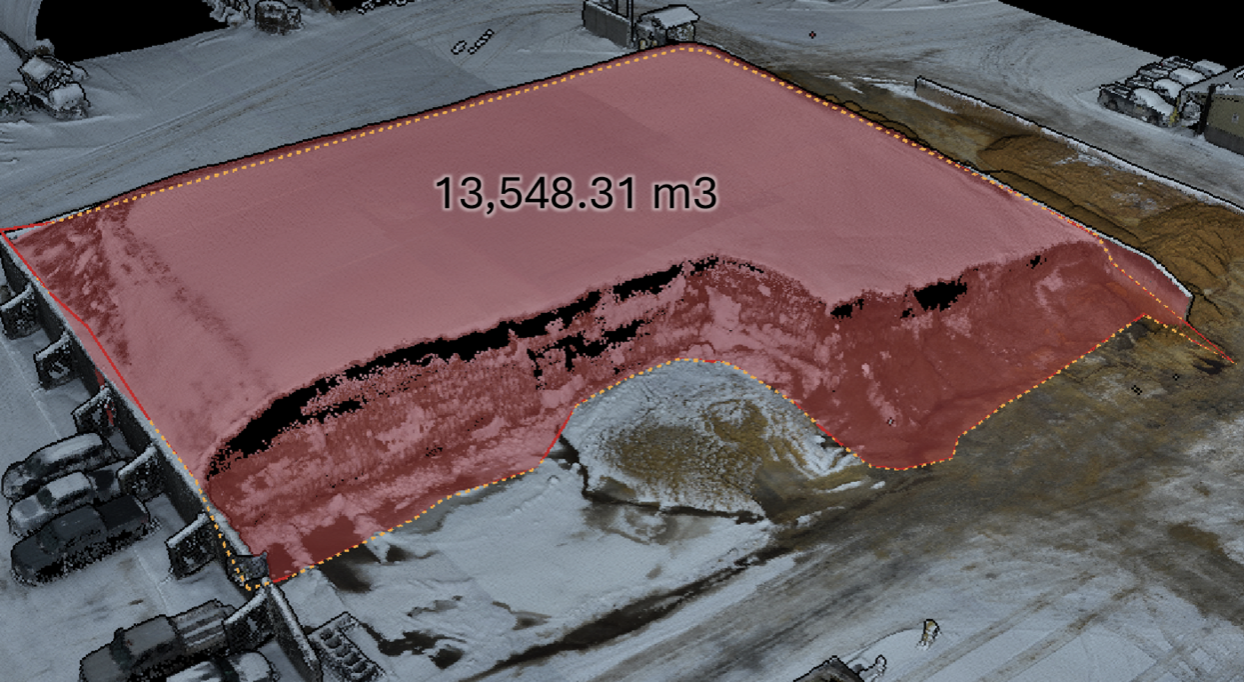
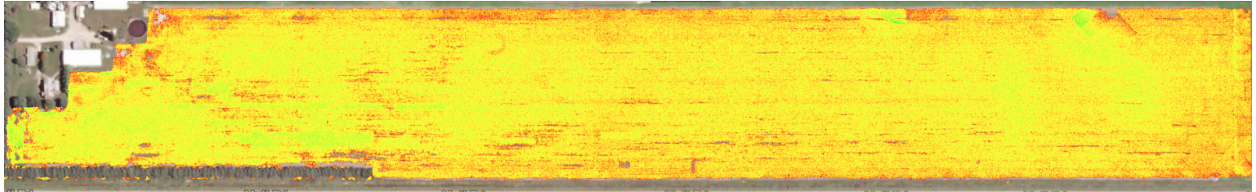
Subsequent Volume Measurement Winter
Challenge
A large livestock operation needed accurate silage volume measurements to support feed budgeting. Traditional methods using loader buckets or manual tape measures were time-consuming and error-prone, especially when bunkers had irregular shapes or uneven surfaces.
Approach
We performed multiple drone-based LiDAR scans of the silage bunkers using a LiDAR-equipped drone. We then processed the resulting point cloud to calculate surface models and measure cut/fill volumes, adjusting for slope, compaction, and bunker geometry. The data was also aligned with historical imagery to track usage over time.
Result
We delivered volume estimates with an error margin under 3%, significantly improving feed inventory management. The entire scanning process took less than 30 minutes, compared to several hours using manual methods. The operation now has a repeatable, safe, and scalable way to monitor feed stocks across multiple sites, enabling better ration planning and fewer feed shortages.
High-Resolution Terrain Mapping for Precision Drainage Design
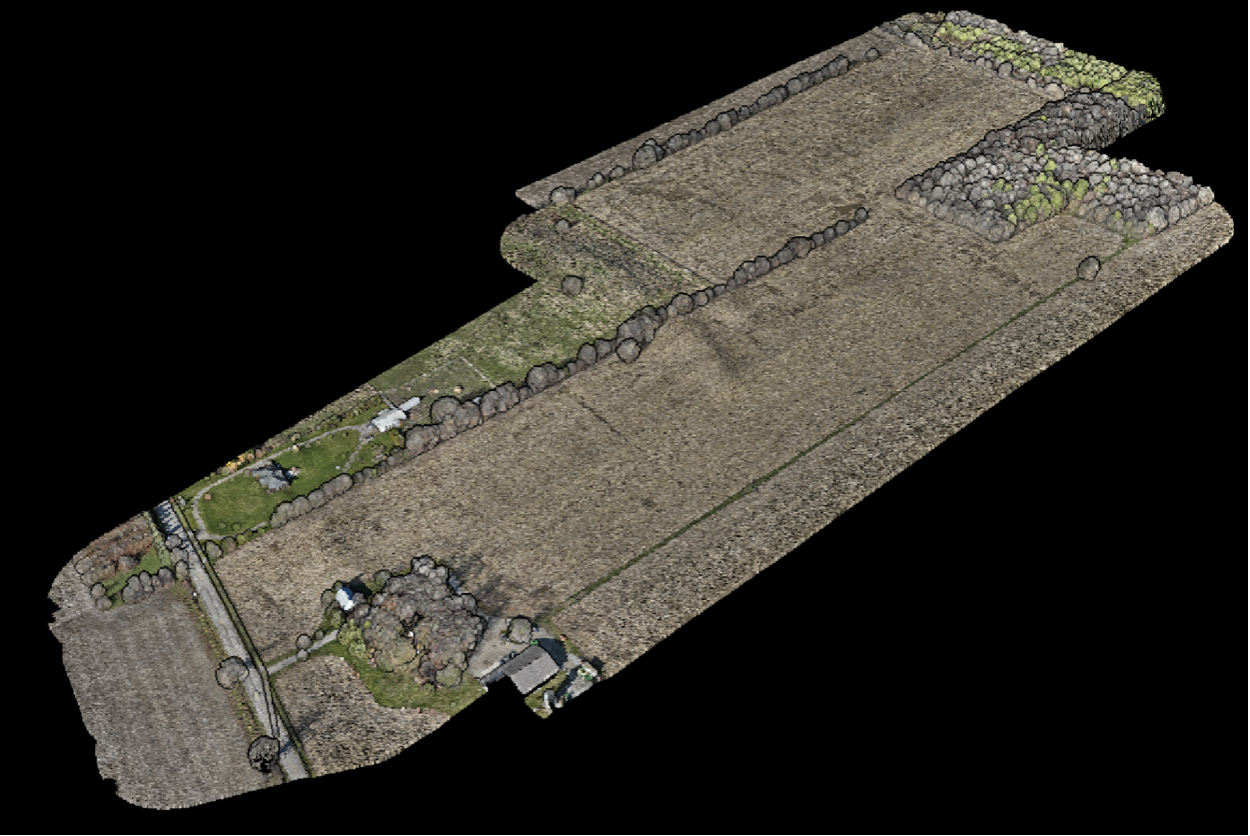
LiDAR 3D Model of the Field

Processed Elevation Profile, Filtering Out Vegetation

Elevation Profile
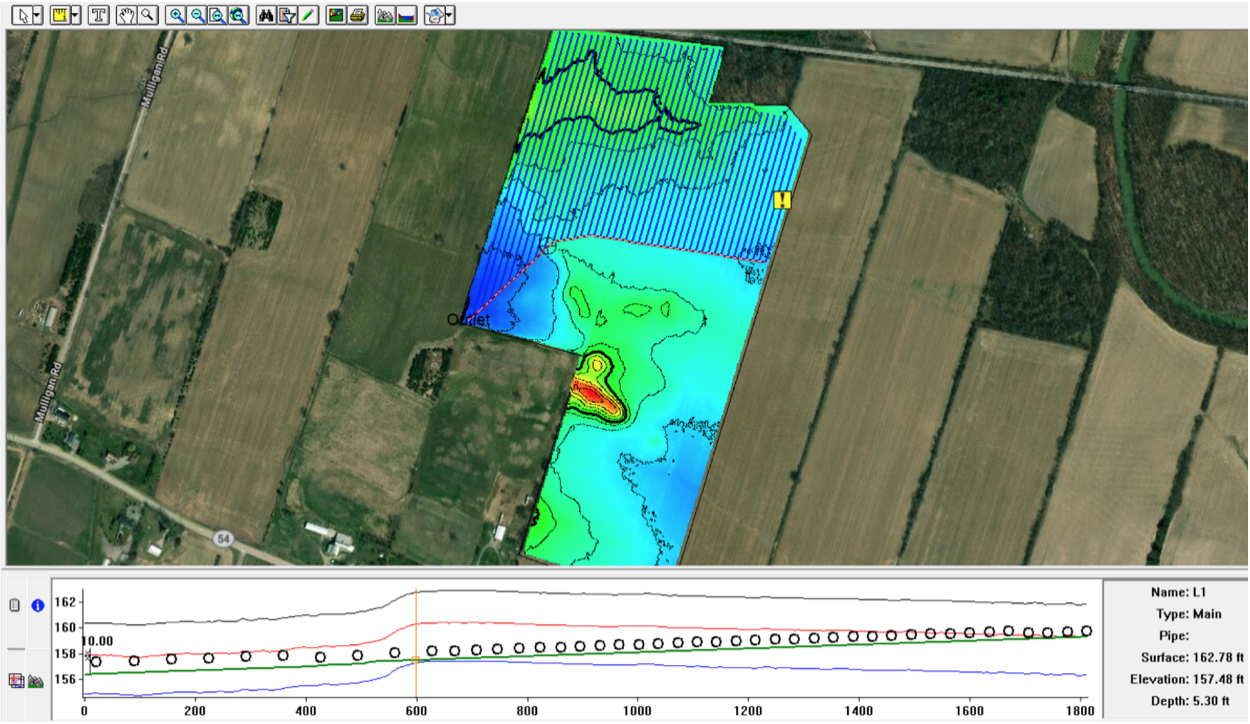
Trimble Tile Design Software Compatible Results
Challenge
A client needed an accurate and detailed 3D model of their 70-acre field to design an effective underground tiling and drainage system. The field had varying topography and vegetation that made traditional surveying methods less efficient.
Approach
We utilized a LiDAR sensor mounted on a drone to capture high-resolution data of the entire 70-acre terrain. After the flight, we processed the LiDAR point cloud to create a detailed 3D model. We then filtered out vegetation and to reveal the bare ground surface and processed the outputs to ensure the data was suited for precision drainage design. The final deliverable was a Trimble-compatible map that drainage contractors could seamlessly integrate into their systems.
Result
The client received an accurate 3D model of the field that enabled precise planning of drainage systems. This not only streamlined the contractor’s workflow but also improved the quality and effectiveness of the drainage installation, helping to manage water flow and reduce soil erosion.
Corn Stand Counts Powered by AI Detection

Close Up Image of Corn Plants

Individual Plant Detection Using AI
Test Plot Showing Blocks of 6-Row Corn Hybrids

6-Row Corn Hybrid Analysis
Field Analysis Showing the Top-Performing Corn Hybrids
Challenge
A precision agriculture client needed to automate early corn stand counts to evaluate hybrid performance. Field scouts were spending too much time walking plots, and results varied depending on who was counting.
Approach
We collected high-resolution RGB drone imagery at the V2–V3 stage and annotated sample images to train a deep learning model for plant detection. The model was optimized to differentiate corn seedlings from residue, shadow, and soil texture. Post-processing analysis allowed us to break down the field into groups of 6 rows as required to select the best performing hybrid.
Result
Our data collection workflow and analysis, paired with AI tools reached 92% accuracy compared to hand counts and processed over 40 acres in less than 24 hours. The client drastically reduced scouting labor, improved data consistency, and used the results to adjust hybrid trial rankings mid-season.
Elevation Modeling & Multispectral Imaging for ONFARM Research
Aerial View of the Site

Point Cloud, Generated to Evaluate Different Drainage Systems
Multispectral Indices Used to Correlate Drainage Systems with Vegetation Response
Corn Field (top) and Early Detection of Tar Spot (bottom) Signs of Plant Stress Using Multispectral Vegetation Indices

Tar Spot Affected Field
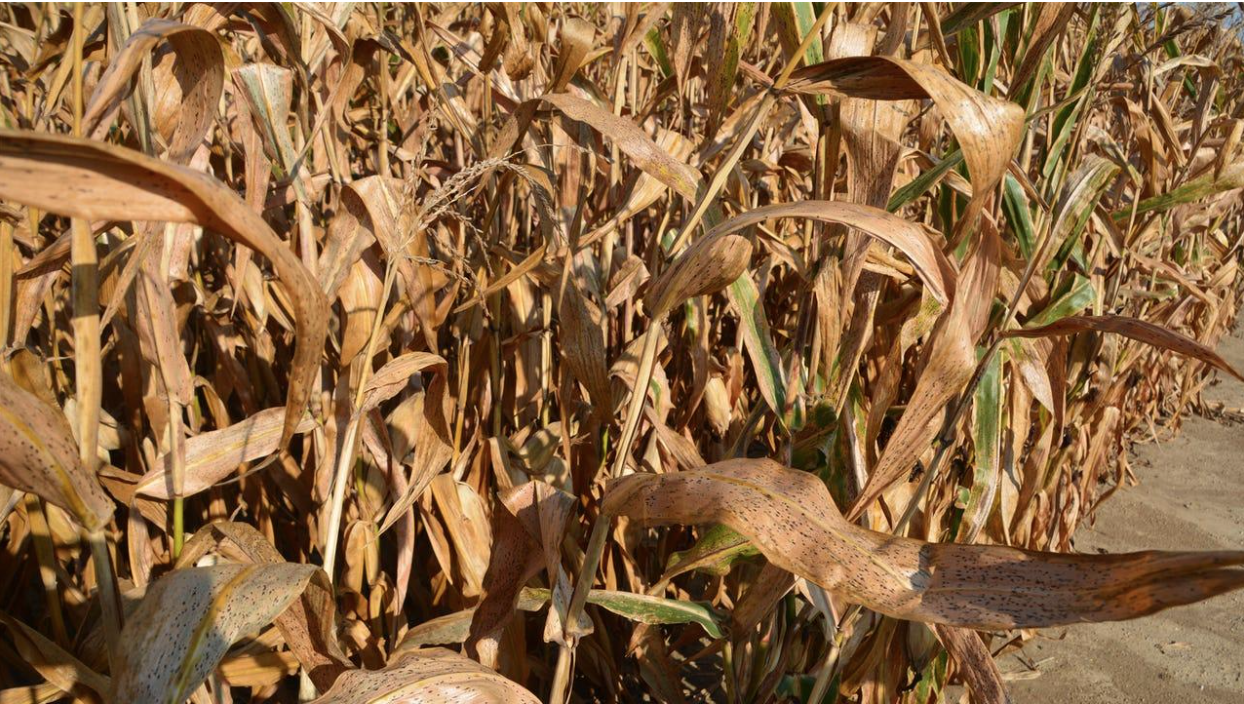
Corn Affected by Tarspot
Challenge
The On-Farm Applied Research and Monitoring (ONFARM) program is a nine-year applied research initiative that supports soil health and water quality research on farms across Ontario. This initiative needed precise elevation and multispectral imaging across several fields to evaluate the effectiveness of farming practices and drainage systems.
Approach
Terralynx deployed LiDAR-equipped and multispectral drones to collect imagery and high-density point clouds over multiple research plots. From this data, we generated Digital Elevation Models (DEMs) with centimeter-scale vertical accuracy paired with vegetation indices to correlate drainage paths, ponding areas, and slope dynamics with crop growth throughout the season.
Result
We supported ONFARM researchers and growers with data that helped improve farming practices and design of conservation drainage systems. Across 400+ acres, our maps helped detect early signs of disease like tar spot and improve the scientific understanding of how water behaves under different field treatments. The results were used in both field-level decisions and policy discussions around best management practices (BMPs) in Ontario agriculture.
Start Your Next Project with the Right Data
Founded in 2017 to help farmers improve crop management, Terralynx has since become a trusted partner for across industries. Based in Ontario, Canada, our teamʼs expertise spans many backgrounds, including agriculture, aerospace, and technology (hardware and software).